
Data Analyst Portfolio
Ali Rabie
Data Analyst with 1+ year of hands-on experience delivering end-to-end analytics solutions using SQL Server, Power BI, Python, and Excel across e-commerce, HR, marketing, telecom, and startup ecosystems.
Built analytics projects that identified 207% YoY growth, uncovered $1.67M in churn risk, analyzed 196K startups across 175 countries, and transformed complex data into actionable business insights.
Core stack
Power BI · Tableau · Excel · SQL Server · Python · R
About
Business-minded analytics with a statistical foundation
I combine statistical thinking with practical analytics to solve business problems using SQL Server, Power BI, Python, Excel, and Tableau. With 1+ year of hands-on experience, I have built end-to-end analytics solutions across e-commerce, HR, marketing, telecom, startup, and retail domains, covering data cleaning, ETL, exploratory analysis, relational data modeling, dashboard development, KPI reporting, and business storytelling. My work includes analyzing 1.45M+ records across 11 relational tables, uncovering 207% year-over-year sales growth, identifying $1.67M in potential churn risk, and analyzing 196K startups across 175 countries to explore funding patterns and business success factors. I enjoy transforming raw data into clear insights that help businesses make confident, data-driven decisions.
Skills
Tools and methods I use
Programming & Databases
BI & Visualization
Analytics & Statistics
Professional Skills
Featured Projects
Analytics projects focused on solving real business problems through data, visualization, and storytelling.
Python · SQL · Power BI
Crunchbase Startup Ecosystem Analytics
Built an end-to-end analytics pipeline for Crunchbase 2013 startup data, combining Python cleaning, SQL Server modeling, and Power BI dashboarding to reveal funding trends, exit outcomes, and geographic opportunity.
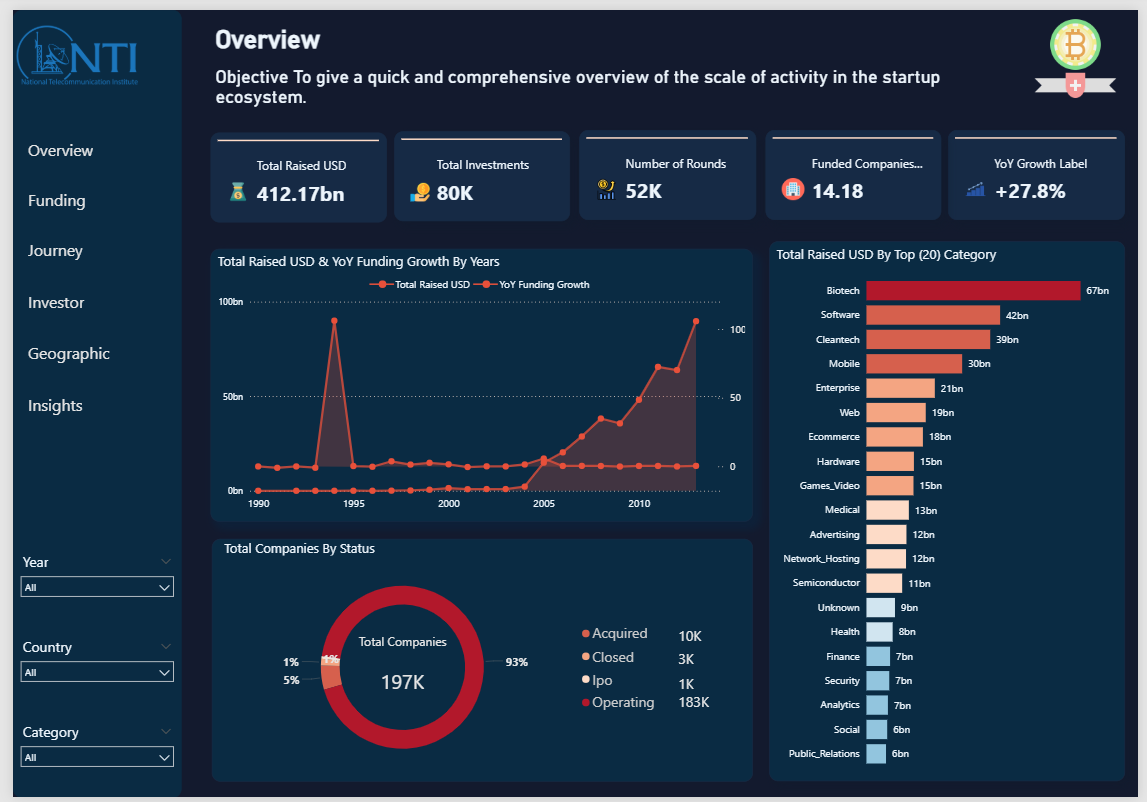
1.45M+ records52K funding rounds$419.7B total funding
View repository ↗
Python · SQL · Power BI
Olist E-commerce Analytics
Built an end-to-end analytics pipeline on 100K+ Brazilian marketplace orders, combining Python cleaning, SQL modeling, and Power BI dashboards to reveal 207% YoY growth and revenue risk from churn.
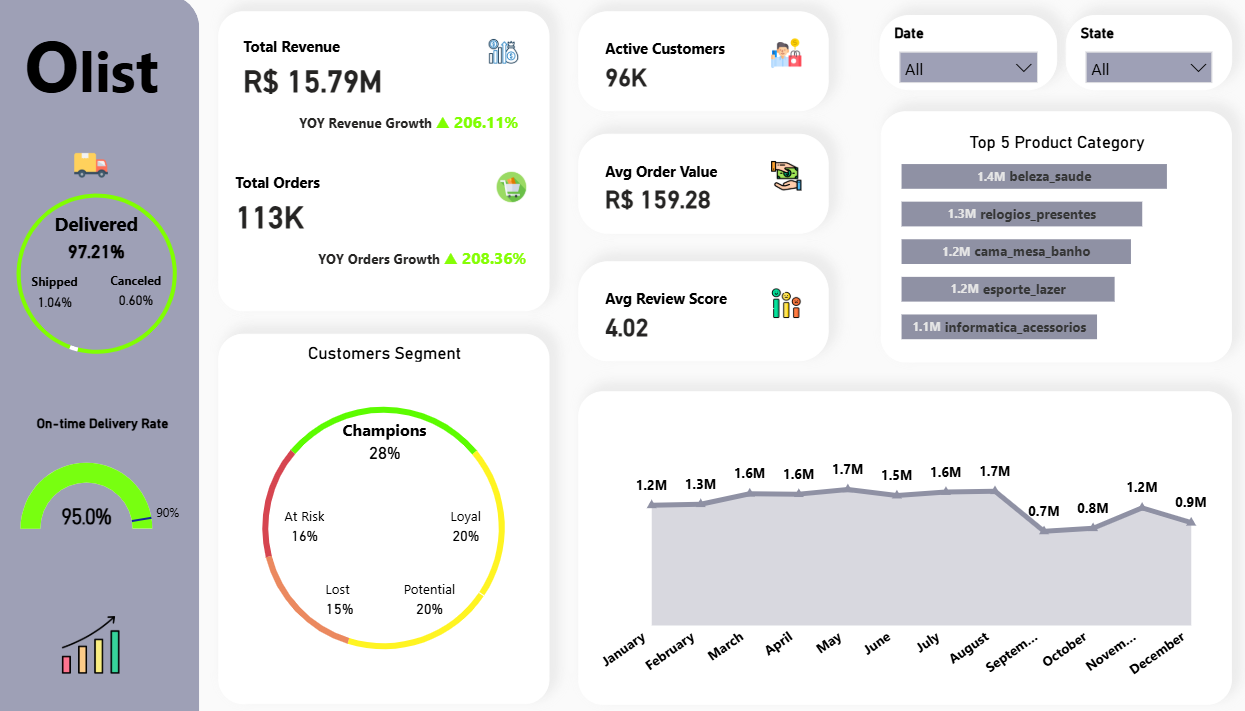
100K+ orders207% YoYR$1M+ churn risk
View repository ↗
Power BI · Marketing Analytics
Marketing Campaign Performance Dashboard
Designed a Power BI dashboard to connect campaign spend with revenue outcomes, highlight negative ROI initiatives, and prioritize the most profitable marketing channels.
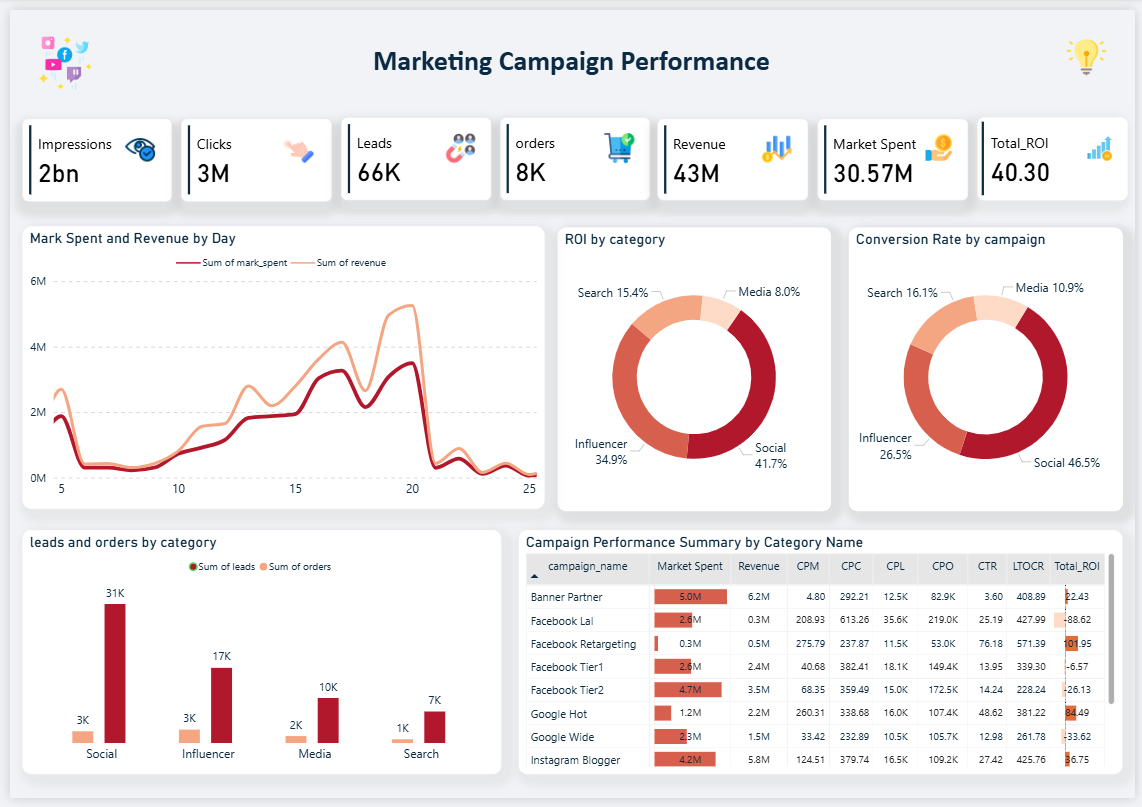
ROI optimizationChannel analysisConversion tracking
View repository ↗
Tableau · Workforce Intelligence
HR Performance Analytics Dashboard
Developed a Tableau dashboard to identify employee attrition patterns, evaluate performance drivers, uncover compensation gaps, and connect workforce metrics with business outcomes across 150 retail stores.
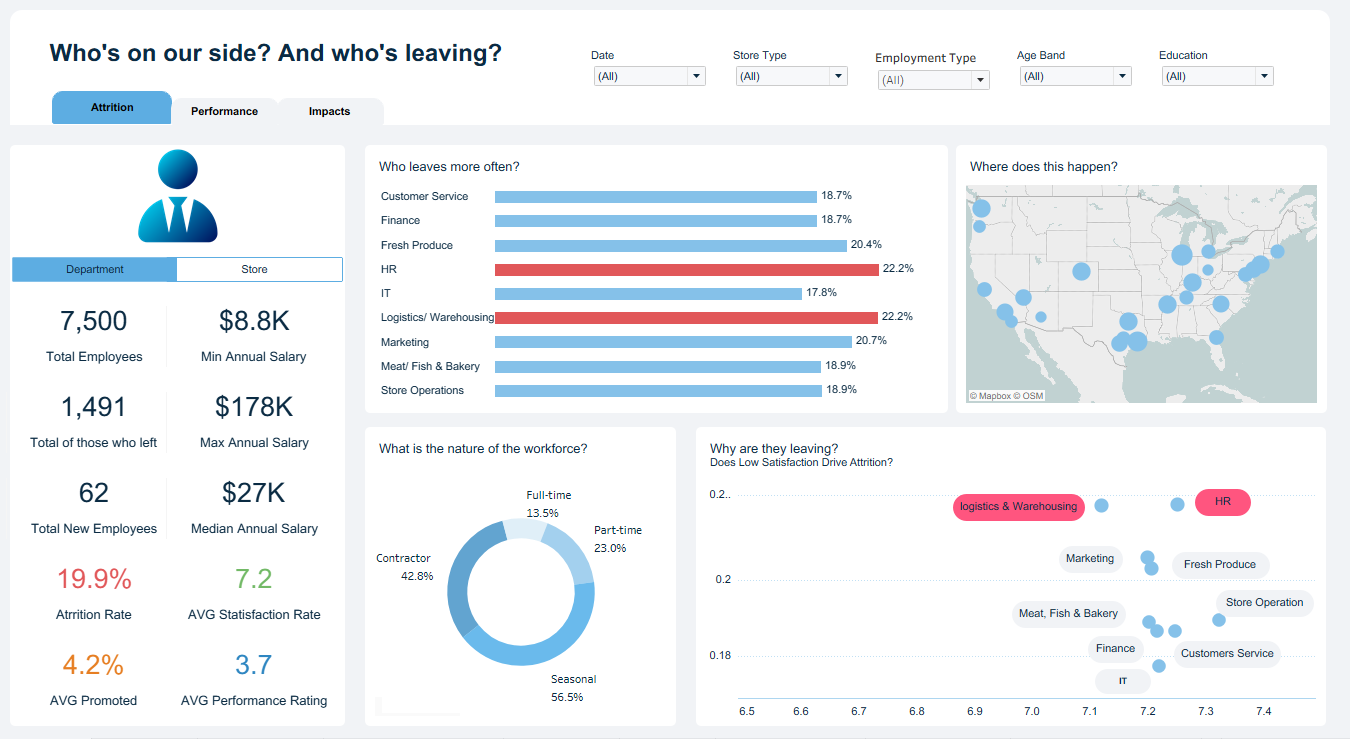
497K+ Records
Attrition Insights
Performance Drivers
Business Impact
View repository ↗
Excel · Analytics Dashboard
Telecom Customer Churn & Call Center Analysis
Analyzed customer churn patterns and call center performance to identify at-risk customer segments, contract-related churn patterns, and service issues affecting retention decisions.
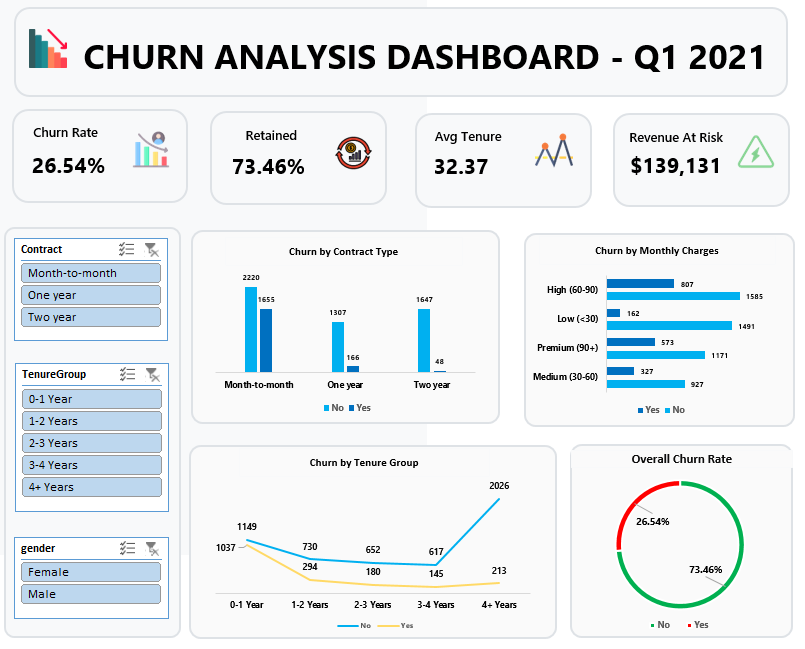
7,043 customers42.7% churn in month-to-month$1.67M risk
View repository ↗
Python · Quantitative Finance
Stock Performance & Risk Analysis
Quantitative analysis of major tech stocks (AAPL, MSFT, TSLA) vs. Gold and S&P 500 using OLS regression, Bollinger Bands, and correlation analysis to profile risk-return tradeoffs.
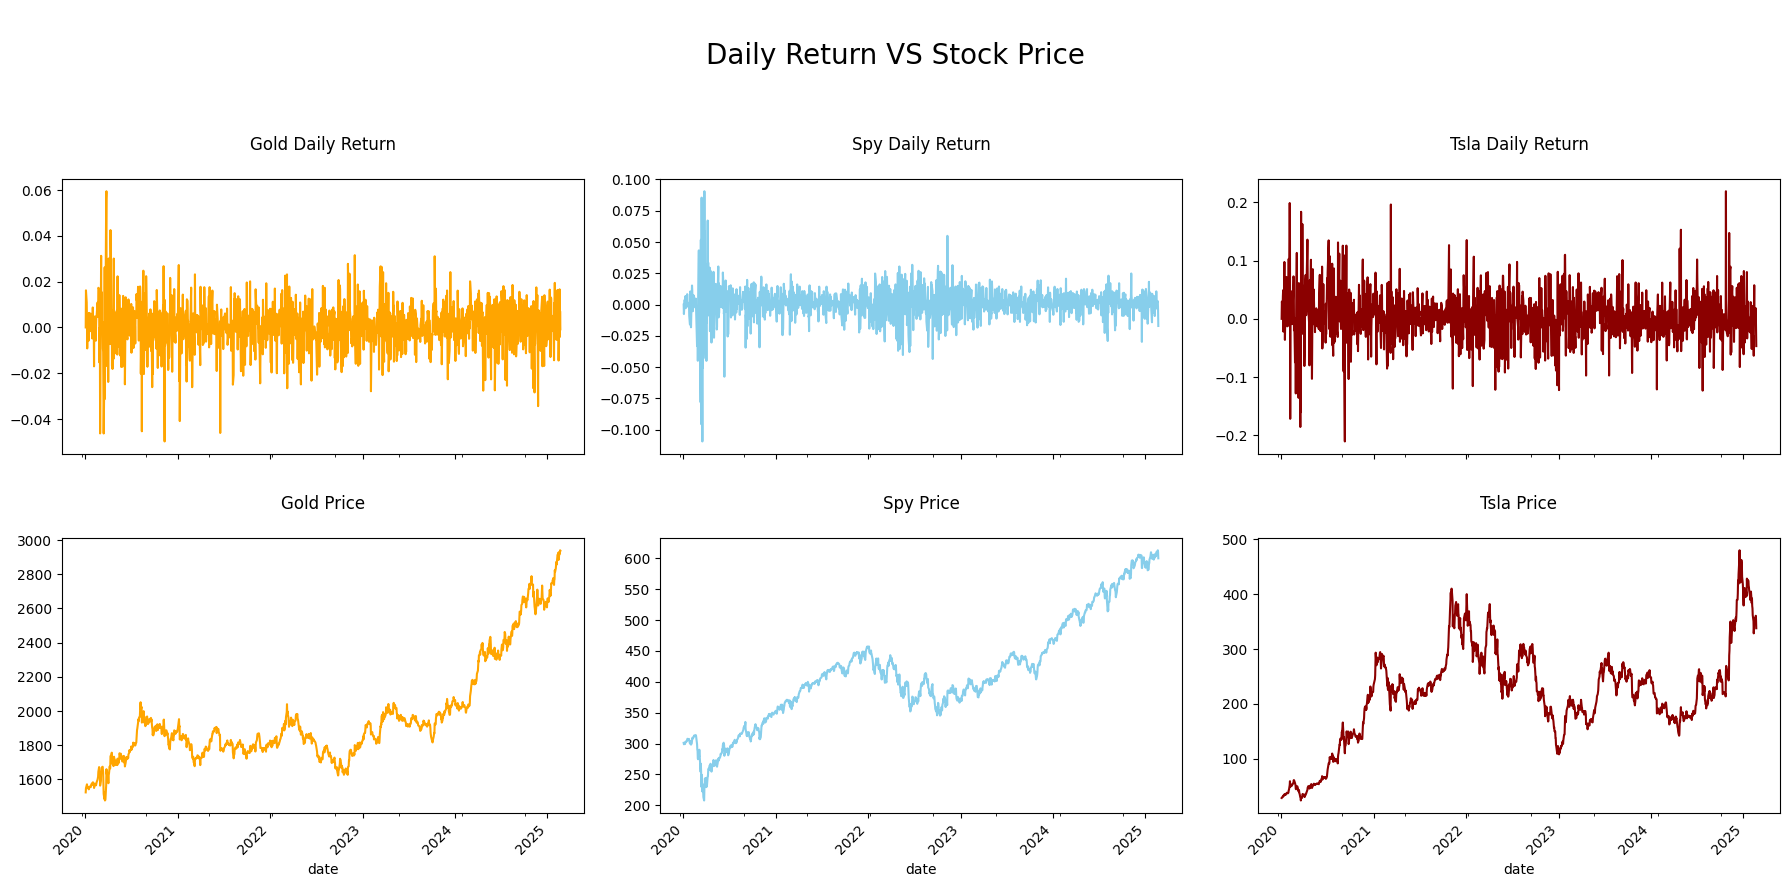
1,292 trading daysTSLA +1,078%Beta & Volatility
View repository ↗
R · Data Cleaning · EDA
Data Science Jobs — Cleaning & Exploratory Analysis
Cleaned and analyzed a messy Glassdoor dataset of DS job postings — handling sentinel values, parsing salary text, extracting geographic data, and deriving job levels. Explored salary trends across sectors, company size, and founding era through 9 visualizations.
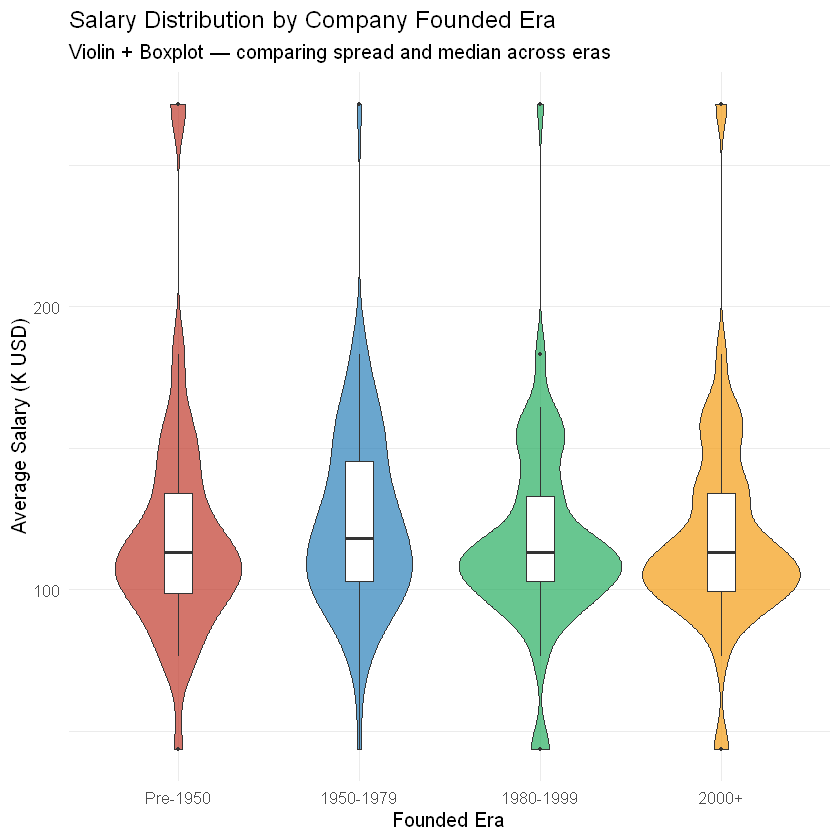
672 job postings
CA leads · 165 postings
84% mid-level roles
View repository ↗
SQL Server · Data Cleaning
Phone Market Data Cleaning & Transformation
Cleaned and transformed a raw mobile phone catalog using SQL Server by removing duplicates, handling missing values, standardizing dates, and extracting structured features from unstructured product descriptions.
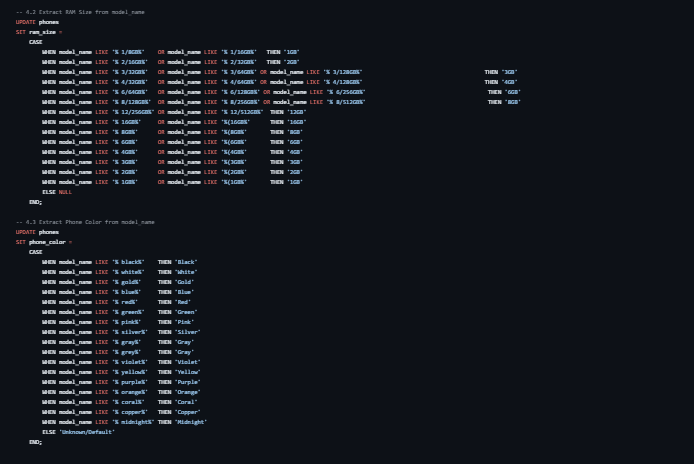
350+ Duplicates Removed
Feature Engineering
SQL Data Cleaning
View repository ↗
Experience
Hands-on experience delivering analytics, business intelligence, and dashboard solutions across freelance projects and professional training.
May 2025 – Present
Freelance Data Analyst
-
Sales Management & Analytics System — Coffee Grinder
Designed and developed a comprehensive sales management and analytics solution to automate pricing, sales tracking, KPI reporting, and business reporting. Built interactive dashboards and reduced manual reporting by delivering real-time visibility into sales performance. Power Query · PivotTables · XLOOKUP · Dynamic Arrays · Data Validation · Conditional Formatting · KPI Dashboards
Mar 2026 – May 2026
Data Analytics Intern — National Telecommunication Institute (NTI)
- Completed a 3-month Data Analytics internship focused on SQL Server, Python, Power BI, Tableau, Excel, and Business Analytics using real-world business datasets.
- Built an end-to-end analytics pipeline on 1.45M+ records across 11 related tables
- performing data cleaning, transformation, exploratory data analysis, relational data modeling, and dashboard development.
- Python (Pandas) · SQL Server (Relational Data Modeling, Joins, Aggregations) · Power BI (Power Query · Data Modeling · DAX)
Certifications
Verified credentials
ITIDA — Information Technology Industry Development Agency
Data Analysis Track
Feb 2026 · 3 Months
freeCodeCamp
Data Analysis with Python
Mar 2025 · 300 hours
DataCamp
Data Literacy Professional Certificate
Dec 2024 · 15 hours
365 Data Science
Building Business Reports Using Power BI
Nov 2024
Maven Analytics
Thinking Like an Analyst
Oct 2024Education
Academic background
Bachelor of Educational Psychology & Statistics
Al-Azhar University, Cairo
Sep 2019 – Aug 2023
3.6 / 4.0
GPA
Statistics
Probability · Research Methods · Behavioral Data Analysis
Languages
Arabic (Native) · English (Good)
Contact
Let’s connect
Whether you're hiring, collaborating, or simply interested in analytics, I'd be glad to connect and discuss data-driven solutions.